The Great Melbourne Lockdown is nearly over. All going to plan we’ll be able to leave the city in 5 more days, making it a total of 123 lockdown days. Considering that I was planning to cycle across the world this year it might sound like spending 4 months trapped in a little house in Melbourne must have driven me nuts. Well it didn’t. In fact our little family coped ok. I got through it by keeping a very strict daily schedule of youtube yoga, meditation, listening to Podcasts, cycling and decorating the house. I also got myself job, started another business and got back into programming. And I rewrote my old Moneylounge App, and I’m pretty chuffed with how it all turned out.

What is it?
Moneylounge is a financial aggregator. It lets me keep track of all the financial transactions I make across my bank accounts and investments. For example, every time I spend money at the supermarket, receive income from my employer, buy or sell an investment, receive a dividend or change the value of an asset, such as when a share price changes. This transaction data can arrive in Moneylounge from 3 different sources, APIs QIF downloads and manual entry.
Some banks in Australia are starting to provide their customers an API to access their data. Up Bank is one of the first. I’ve integrated Moneylounge with Up Bank so that all my Up Bank transactions are immediately synchronized every time that I open the App. They also get categorized, so that something like a bank transactions from Woolworths gets tagged as “Food” or Qantas as “Travel”.
For other bank accounts that don’t have API I need to use QIF download files from that banks Internet Banking site. These can be loaded into Moneylounge and again categorization is automatically done.
Finally investment transactions, such as dividends or buying and selling shares, get input manually. Generally I’m not selling shares as often as I am buying food from the supermarket so there’s usually not a lot of manual transactions that need to be entered.
It takes about 15 minutes once a month to enter an entire month of financial data into Moneylounge. And, once that data is there, the fun begins.
Analysis
As you know from my earlier blog articles I’m passionate about financial independence, escaping the rat race and freeing up time to do interesting things then working in an office. Over the years I’ve found that achieving these goals boils down to monitoring three financial metrics. Firstly, need to keep track of my net worth. Secondly, I need to ensure that my income exceeds my expenses. And finally I need to know the profitability of my investments. Nothing else really matters. To this end I’ve designed Moneylounge to provide these insights.
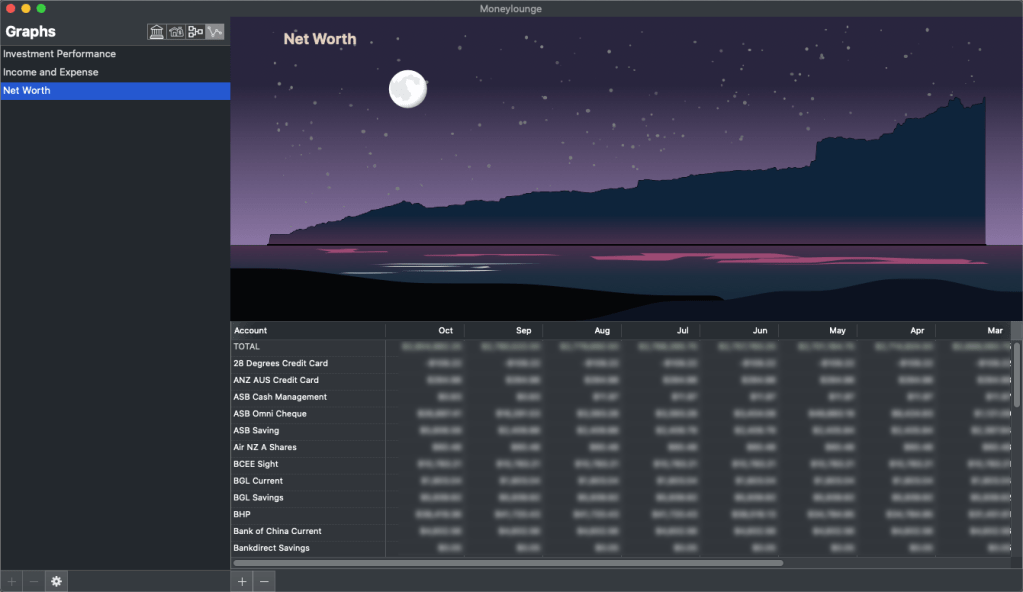
Firstly, the Net Worth graph shows the value of all assets on a month by month basis. This calculation is pretty simple: (Bank Account Balances + Value of all Investments – Loans). Ideally this graph should be trending upwards. This is the least relevant graph for me, as I’m much more interested in the return of the assets that I own rather then the value that someone else would pay for them. However, it’s still nice to check if things are moving in the right direction.

Secondly, the income vs expenses graph. This is the most important financial metric that I monitor, and it’s the only one that I have control over. It’s simply (Income – Expenses) for each month, broken down by category. Many folks in the FIRE community measure their savings rate (i.e. aiming to save 60% of income). I’ve never bothered with this as it just creates stress and these sort of artificial goals just serve to diminish the quality of life. Instead I just use this chart to check that I’m not being stupid with spending. Recently I’ve been tracking the category “investment income” and comparing that to expense. If I can keep the income that I earn from investments, which in my case is mainly dividends, above our living expense then we’ve truly attained ‘financial freedom’.

Lastly is the investment performance graph. This simply calculates the total return on all investments (capital gain + dividends). In the early days this was negative because I had a wonderful ability to pick terrible investments. Fortunately these mistakes were made with small amounts of capital and as I’ve grown older and wiser I tend to pick simple index funds or local shares that pay good dividends. For long term investments it’s good to know which have performed well and which haven’t, if only to inform better future decision making.
Financial art

Many financial Apps end up looking like nothing more than a glorified spreadsheet. I didn’t want to fall into that trap when building Moneylounge. So I invested a few days of lockdown time to build a pretty graph engine that draws the graph against an artistic landscape background. In time I’ll add a few different art templates, to make it look even more interesting.
Measuring Sustainability
I’m now working with CoGo.co a sustainability startup. One of the things they do is take personal bank transaction data and use it to calculate a carbon footprint. I want to do the same in Moneylounge. I want to add a fourth, Carbon Footprint Graph, one that will be just as important to me as the other financial graphs. Since I have 20 years of data ready to go I should be able to use that to calculate the carbon footprint of my family consumption over that time, and potentially even measure my lifetime carbon footprint. What I’d love to do is work out how much is money needed to offset this and leave it in my Will. Its my way of acknowledging that the actions I’ve made in my life has caused harm to the planet and when I die then I have a moral obligation to repay that debt.
I’ll write another blog post when this is done!

2 thoughts on “Moneylounge v2”